OnDeck
Designing a real-time data system for slow-pitch softball
Overview
In my free time, I play a lot of slow-pitch softball. I love the nuances of different hitters and their tendencies and I wanted to find a way to use my team’s batting statistics to work in my team’s favor. I decided to explore and design a player management system that lets a user track position and lineup changes, and capture complex game events quickly, while transforming this into actionable suggestions and accurate statistics.
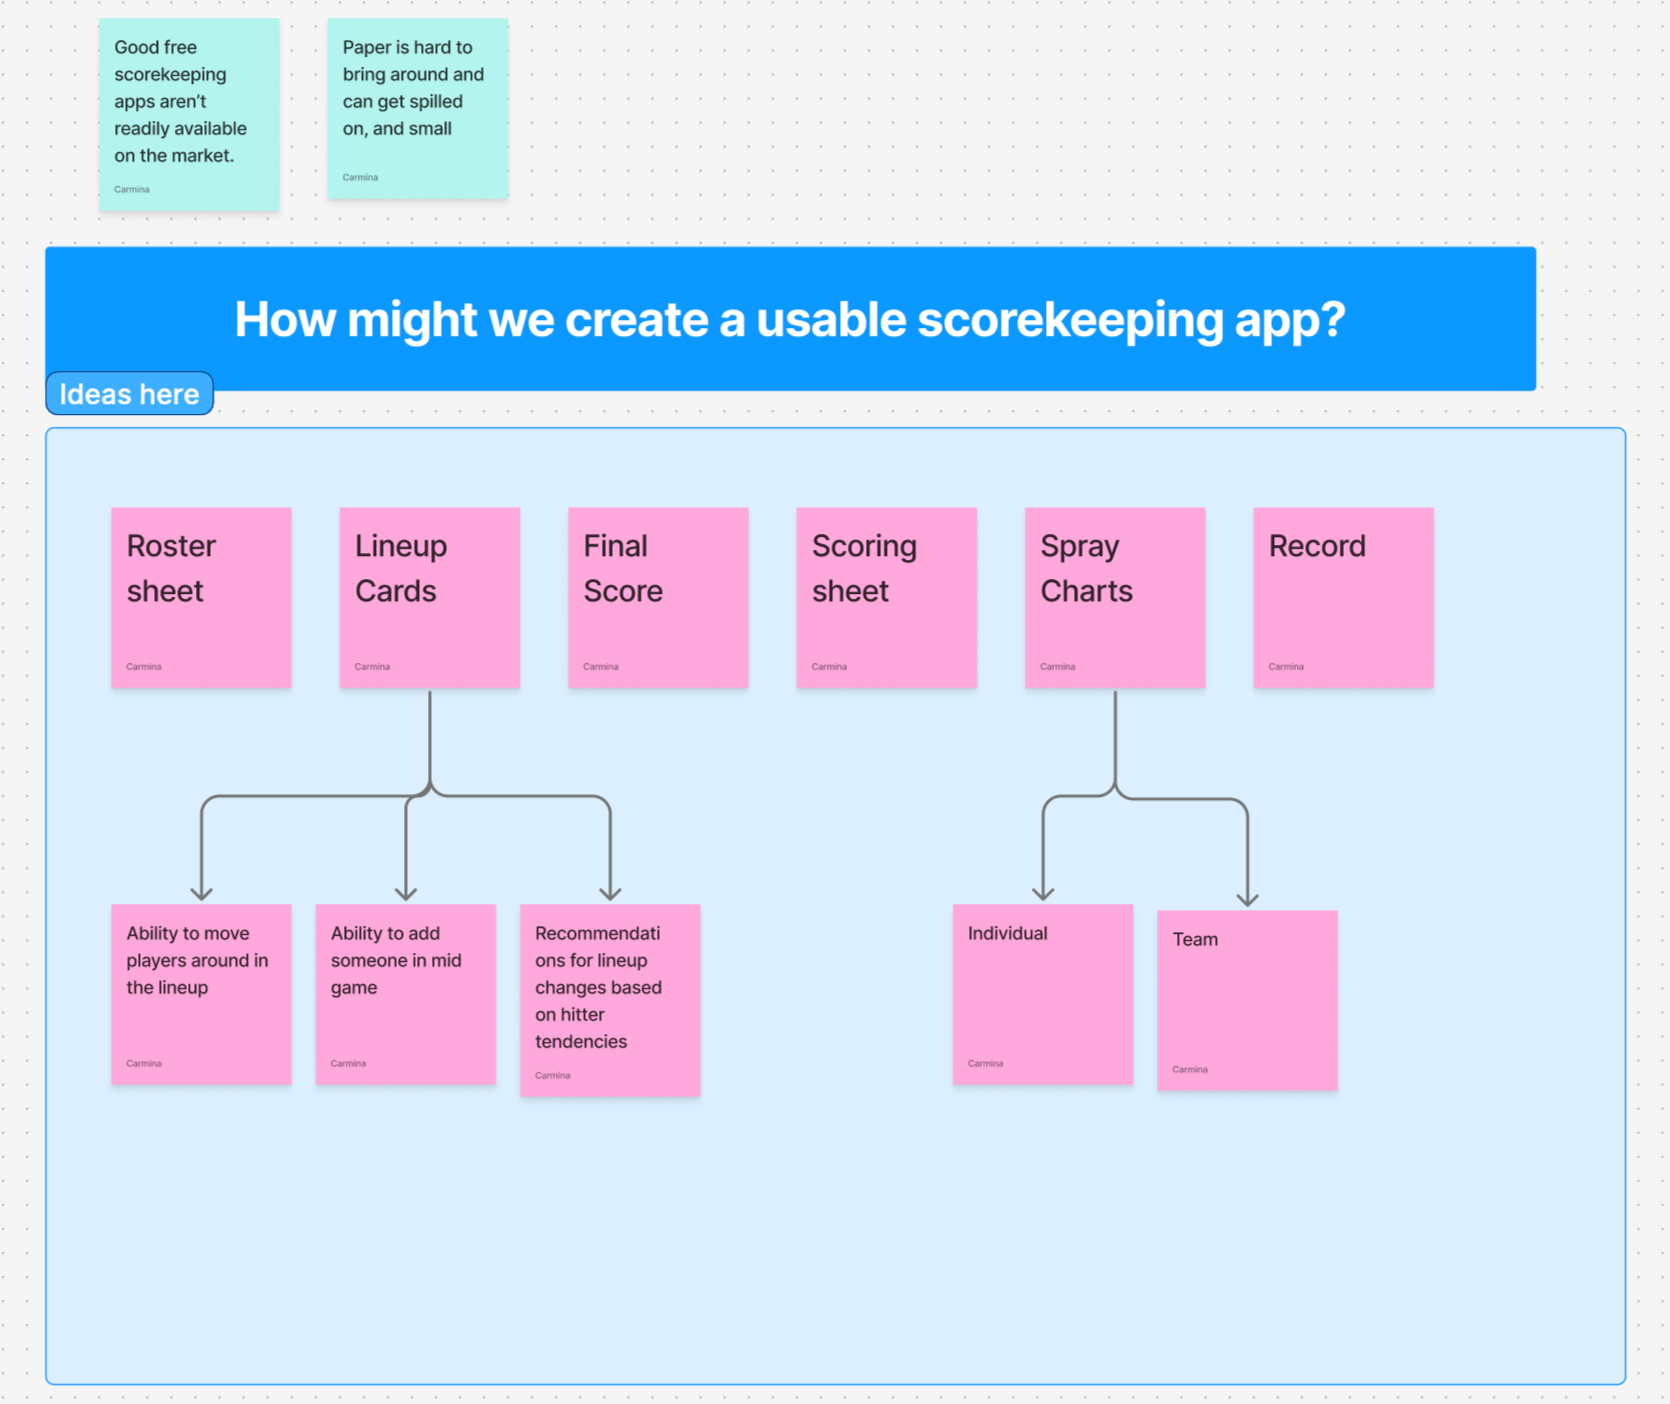
Traditional paper scorebooks are timeless, but inconvenient for those playing and scorekeeping at the same time (and not to mention, it can be messy in a beer league). Most good scorekeeping apps are hidden behind paywalls or don’t provide the flexibility for certain lineups. Because of this I’m looking to explore: How might we create a single, seamless experience that helps teams coordinate their players, manage their lineup, and accurately capture game data?
Role:
UI/UX Designer
Tools Used:
Figma (Figma Design, Figma Make)
Duration:
July 2026 - Present
Scope
System Needs
(What does the system need to do?)
to ingest inputed game events and represent data accurately
to be editable in case of input error during or after a game
to recommend impactful lineup changes based on statistics
Users
(Who are our users?)
Scorekeepers
Players who are both playing and scorekeeping
User Needs
(What do they need?)
to accurately track game events in real time without getting overwhelmed by the amount of information to input
to quickly remedy any input mistakes
to understand analytics and suggestions made by the system
Design Process
Developing Concepts
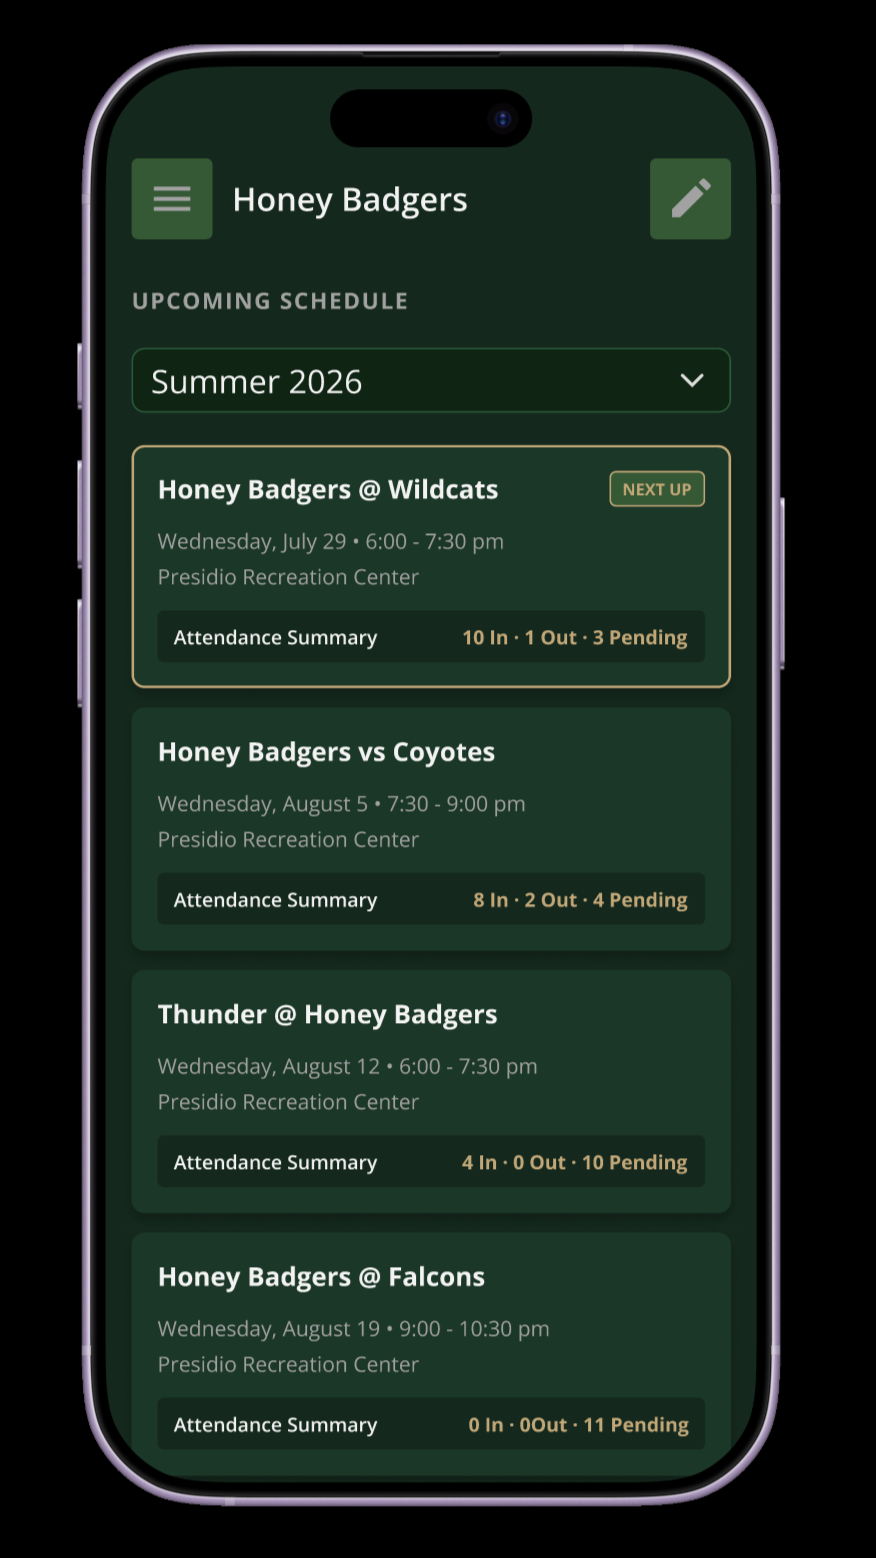
All of my slow-pitch softball teams rely on a mix of group chats, spreadsheets, paper scorebooks, different apps, and memory to manage games. Players need to confirm availability, captains need to build lineups and positions, and someone has to accurately capture what happens during the game. This information is interconnects: a player’s RSVP affects the lineup, the lineup affects positions, and every play recorded during the game contributes to that player’s and the team’s statistics.
I’ve used several apps (i.e. BenchApp and Slug Stats) and they all had their pros and cons. I loved BenchApp’s RSVP feature for headcount and setting up the lineup, but there wasn’t a way to track statistics. I thought Slug Stats was a good app for being a free application on the Apple Store, but it was confusing trying to remedy any input mistakes or score based on different fielding configurations. I explored combining all my favorite design aspects of these systems into a single one-stop-shop for team management.
The Product
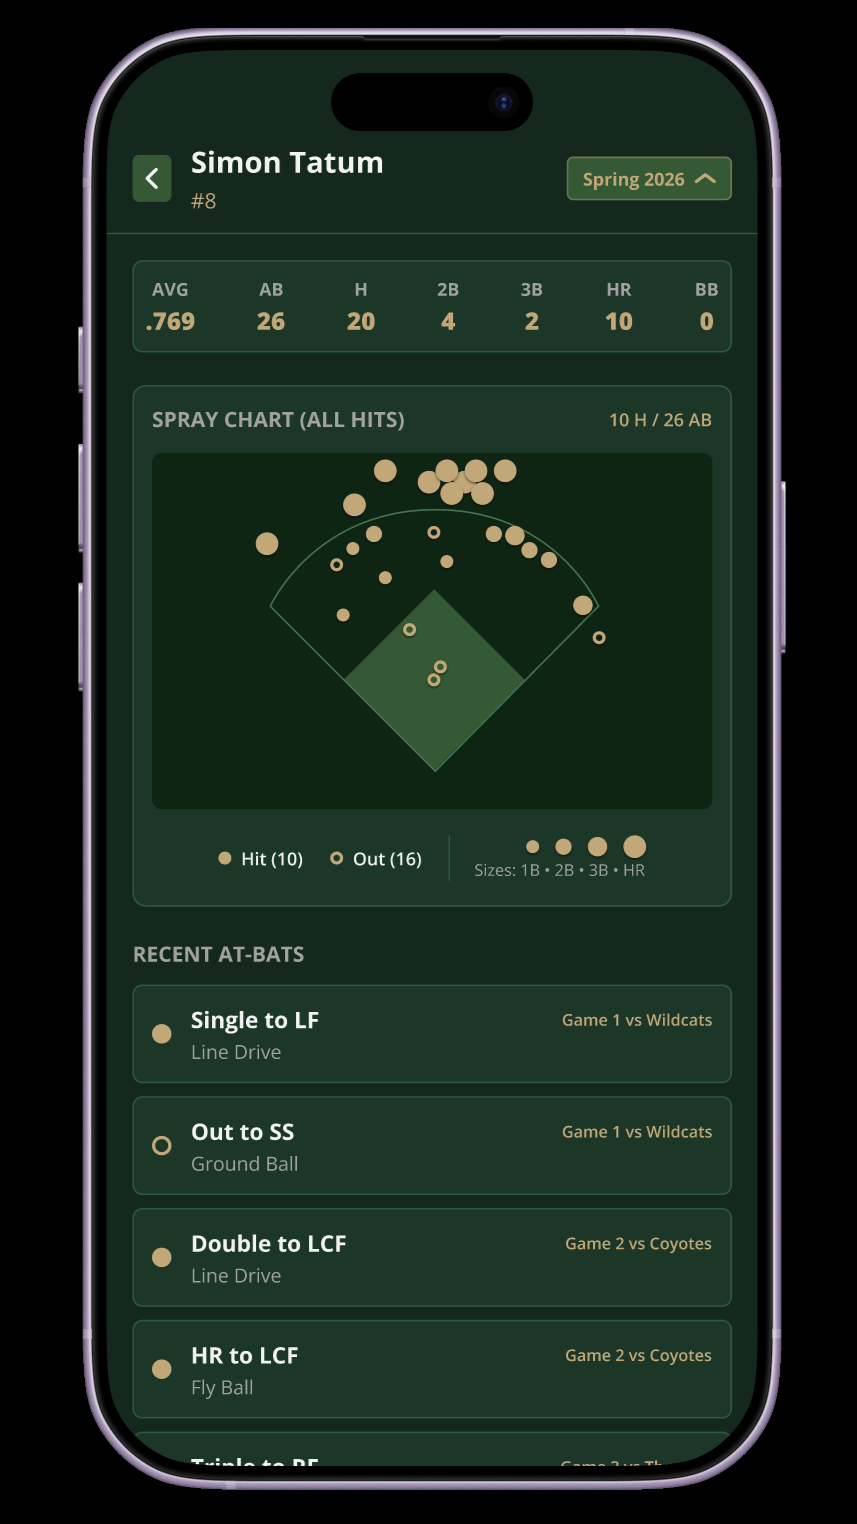
Rather than treating scorekeeping, roster management, and statistics as separate feature, I designed them as intertwined parts of the same system.
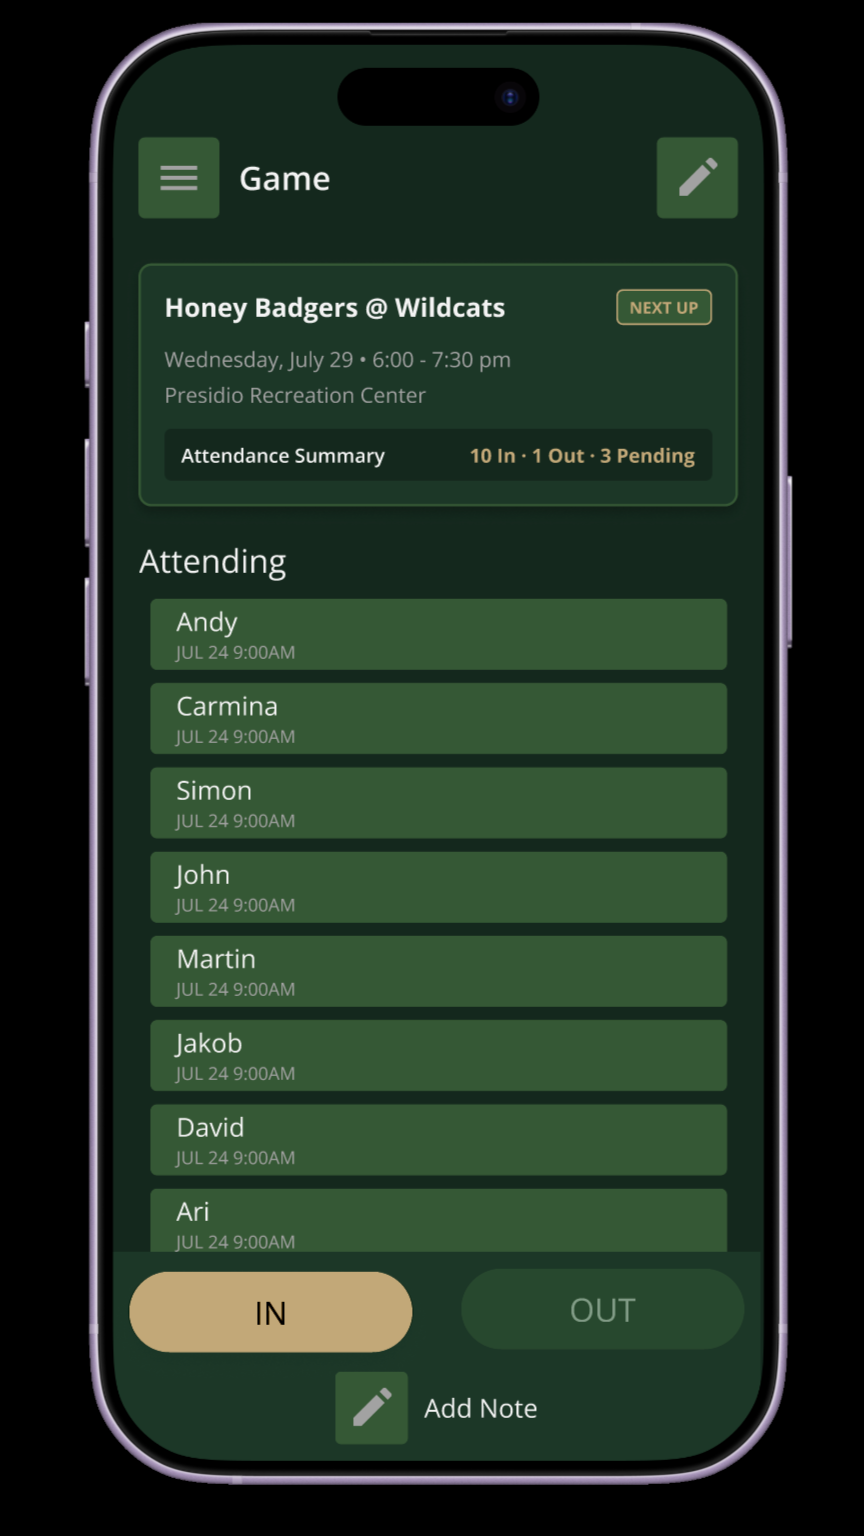
RSVPs to scorekeeping to statistics tracking all in one app.
Key Design Challenges
I identified several challenges in my current workflow:
-
How do you build a lineup when availability is constantly changing?
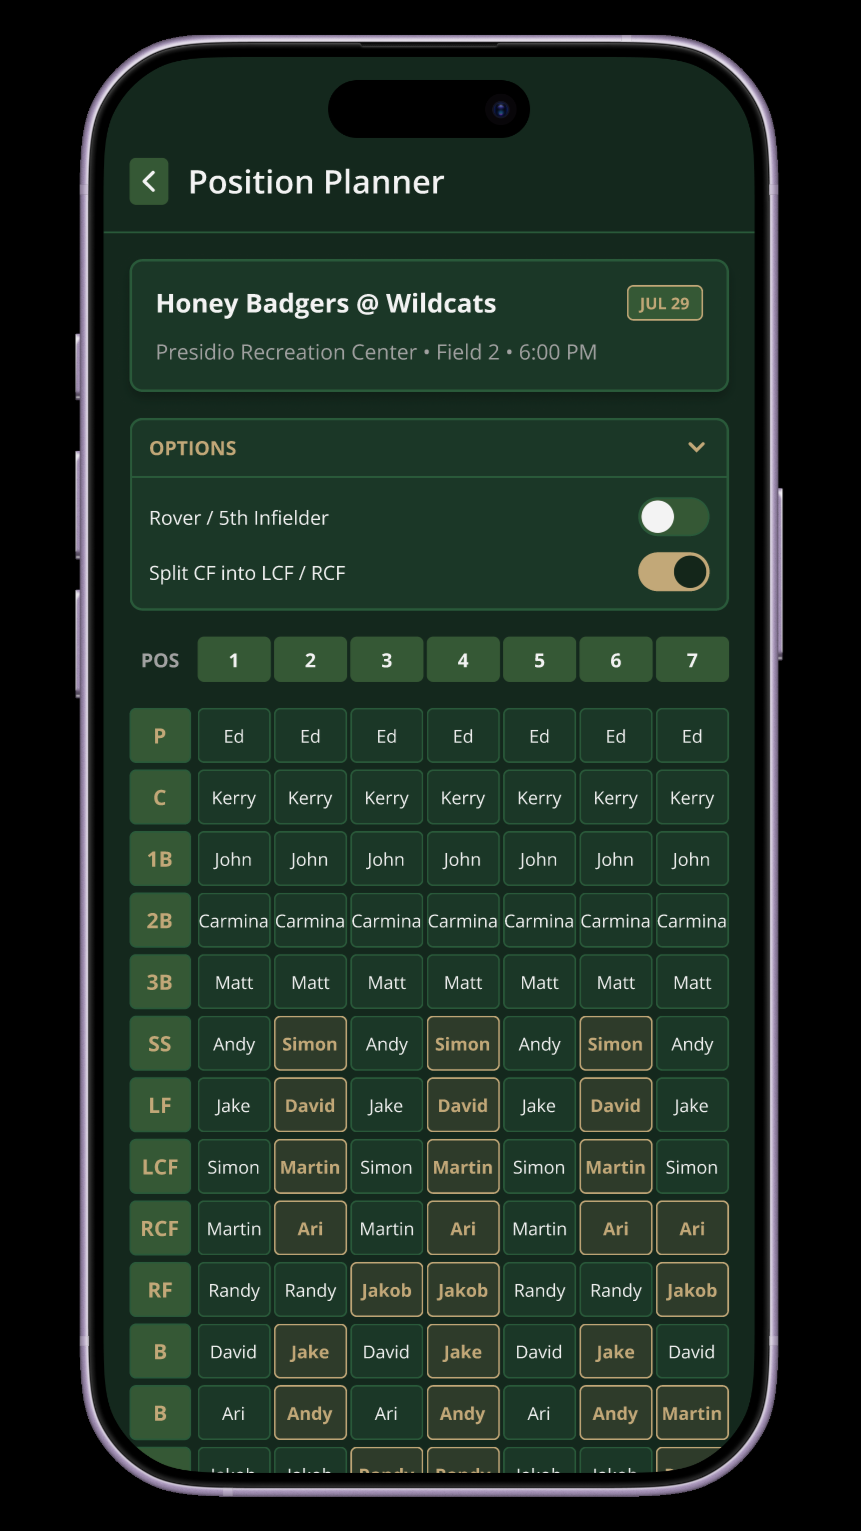
I tackled this by visualizing positions in a matrix rather than on a typical field visual. This allowed for better flexibility for ever-changing fielding positions and better awareness of who is playing where and with who. Typically, my team likes to keep the same fielding positions because it’s comfortable and we work well together. When key players are out for whatever reason, we start to panic on who plays where and when. Developing this feature solves the challenge of organization and availability.
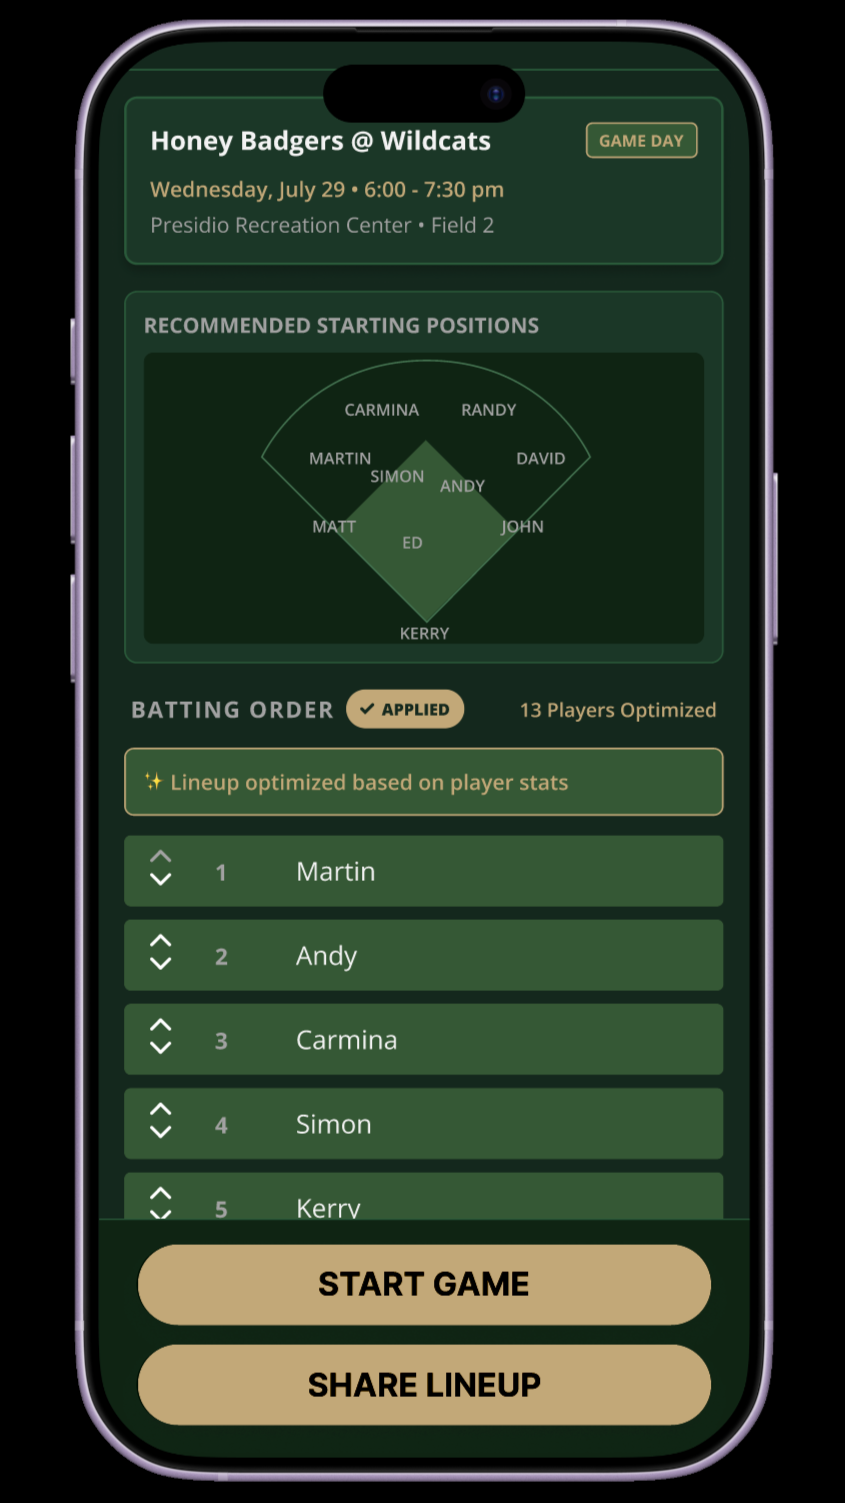
For the batting lineup, I took a simple approach of having movable player cards in the lineup, so it’s easy to rearrange if someone doesn’t show up or custom lineups are needed.
-
How can the experience be simplified to where anyone can do it?
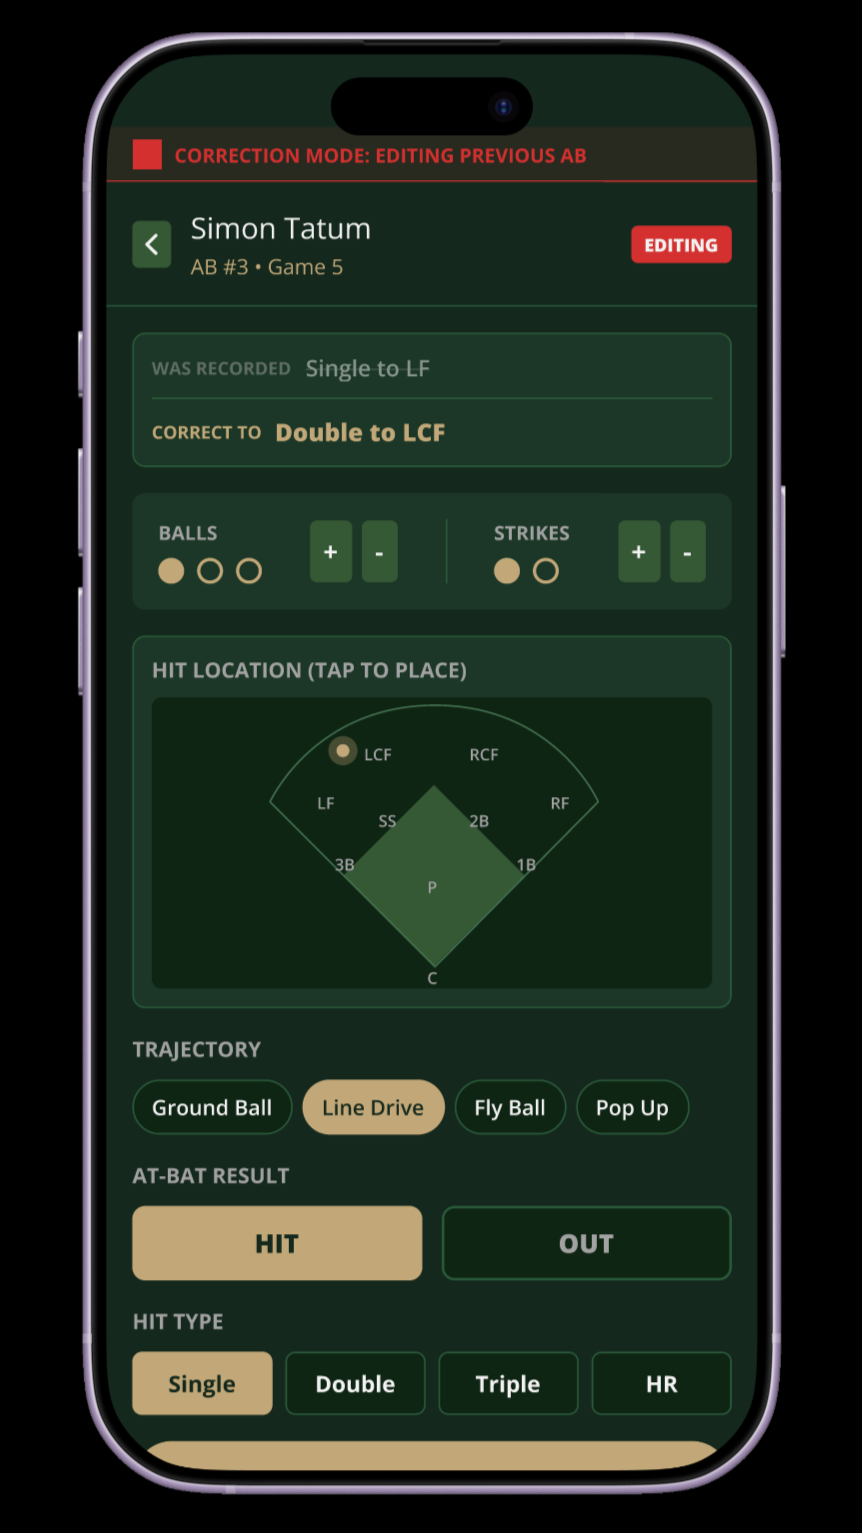
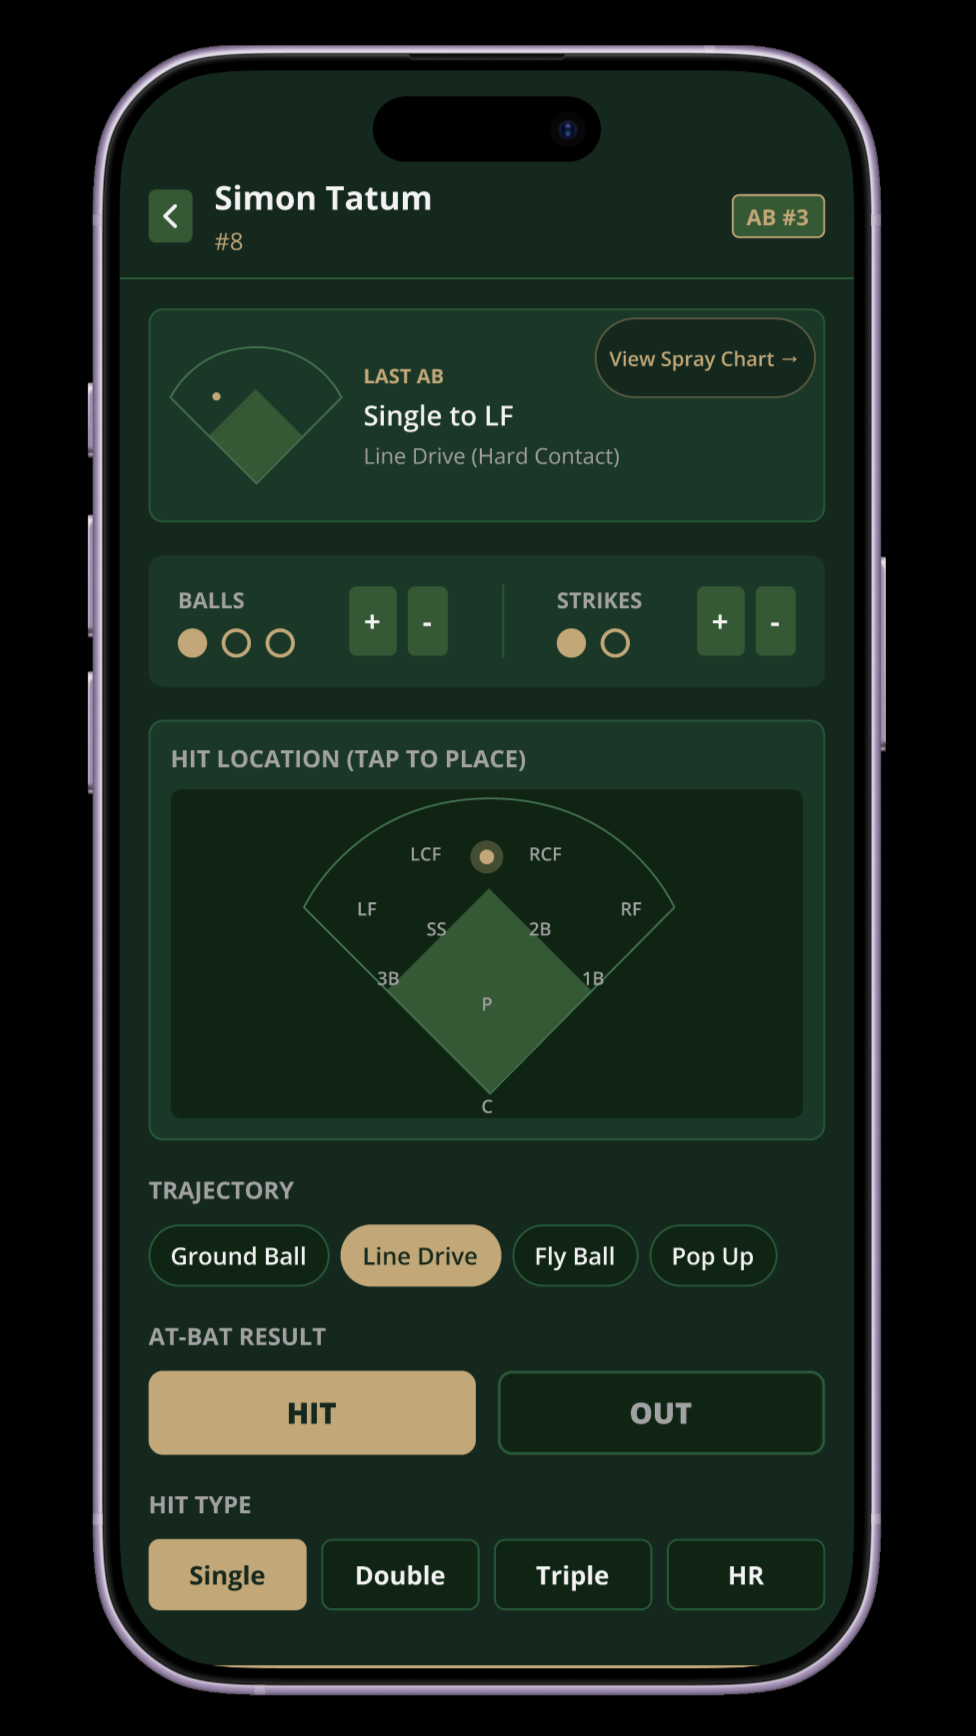
As part of the scorebook feature, I made sure to include layman’s terms. Instead of remembering different symbols and terminology, the user can simply click “Single” and select where on the field it was hit. This makes it easy for anyone to do, even those who barely know the game.
-
How can mistakes be corrected seamlessly without missing a beat?
Instead of asking users to manually correct every statistic affected by an event, I designed the system around the original event as the source of truth. Editing the event automatically recalculates the dependent data.
Outcomes
This project pushed me to think beyond individual screens and consider how a product can turn complex, interconnected information into a simple experience. I learned that designing a data-intensive product starts with understanding the relationships between data, which is not just deciding how that data should be displayed. I also found that error recovery is just as important as the primary workflow when users are entering information in real time. Ultimately, the project strengthened my ability to balance data complexity with usability, giving users the information they need without overwhelming them.
Because this is a side project, these are just static mockups for the time being. I hope one day I can actually bring it to life to actually use on the Honey Badgers and my other teams. I hope to explore development and pushing this to be a live application one day, and possibly help another softball-obsessed nerd.